|
|

|
|
|
| About the Measurements.. |
|
Wind Speed and Direction
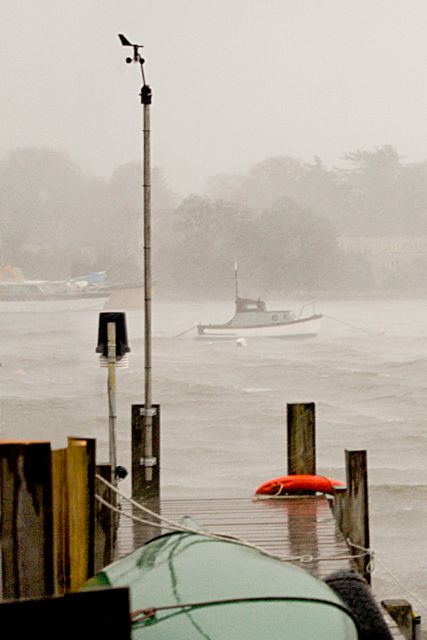
 The wind is measured by a cup anemometer and wind vane mounted on a 4m pole at the end of the jetty. The photo shows the installation on a stormy day! If the wind direction is from east through south to around west-southwest the anemometer and wind vane are reasonably exposed. Around a west direction you start to see the effect of a nearby block of flats ("Quay 2000"). For more northerly wind directions the houses along Priory Road cause the wind to be gusty in speed and direction and the measured wind will be significantly lower than the true value. [more details of the anemometer exposure]
 The wind speeds are displayed in m/s because that is the correct metric unit for measuring the wind ...and having spent my career doing that I'm too old to change! For knots multiply the m/s value by 2. For miles/hour you need to add a further 15%.
The table shows my version of the Beaufort Scale - click on it for an explanation!
The wind speeds are displayed in m/s because that is the correct metric unit for measuring the wind ...and having spent my career doing that I'm too old to change! For knots multiply the m/s value by 2. For miles/hour you need to add a further 15%.
The table shows my version of the Beaufort Scale - click on it for an explanation!
Example: 5m/s = Force 3 = 10kt (= 11-and-a-bit mph)
|
|
Temperature and Humidity
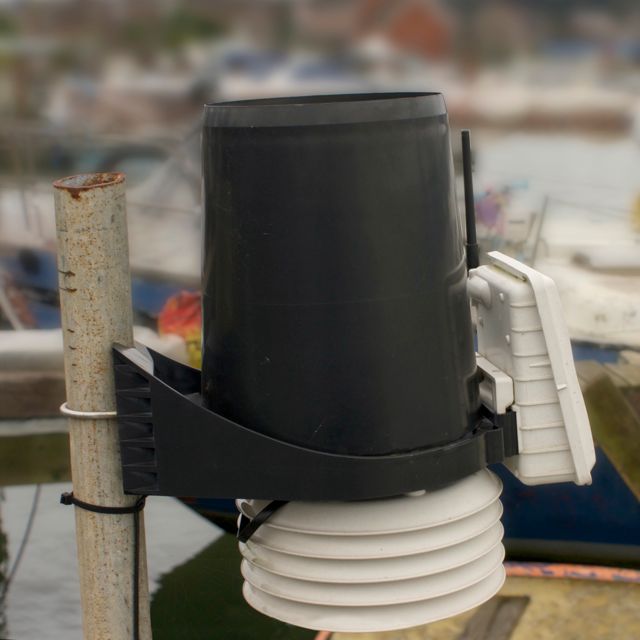
 The main part of the weather station (see photo) consists of a black cylindrical rain collector below which is a stack of white "plates" which form a "radiation shield" for the temperature and humidity sensors - it stops them getting heated up in the sun. The white box to the right of the rain collector houses the electronics and the radio transmitter which sends the data back to the house. Situated at the end of the jetty, the sensors are well exposed to the surrounding air and normally should give accurate readings. However remember that they are over the river. In some circumstances (e.g. a calm, frosty night) conditions over the river may be different from over the land even just onshore.
|
|
Rainfall
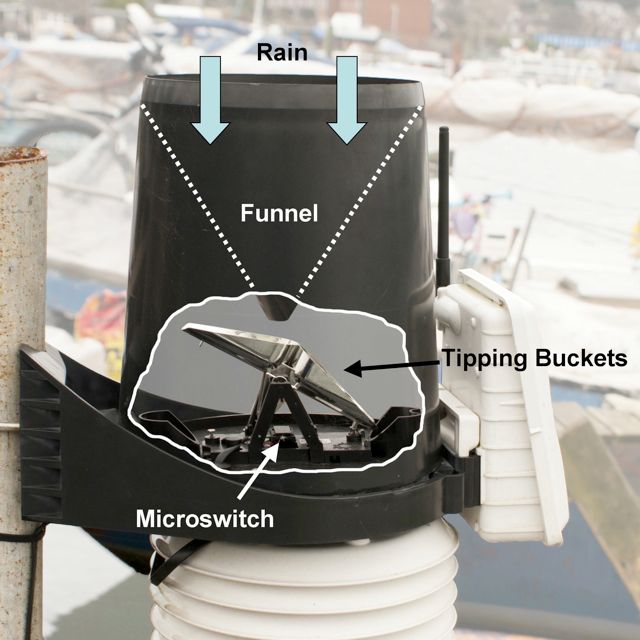
 It is important to realise that the rain gauge measures the amount of rain, not whether it is raining! The diagram shows how the rain is measured (click to enlarge). A 5" diameter funnel catches the rain which drips into a one of a pair of buckets on a see-saw. When the bucket is nearly full the see-saw tips, clicking a micro-switch, and the bucket empties. Now the other bucket starts to collect the rain. For my rain-gauge, each tip represents 0.01" of rain. That means that if it is raining hard the buckets fill and empty frequently and the data will indicate continuous rain. However for light rain or drizzle the bucket may only fill after a time so for most of the time it will look like the weather is dry! Also early morning dew might just be enough to fill the bucket and cause it to tip - so if you see 0.3mm of rain (0.01") indicated for the early morning - that's probably why!
|
|
[Values in the top banner are updated every 10 minutes, refresh your browser to see the latest] |

|
| Powered by WeatherCat
|
|